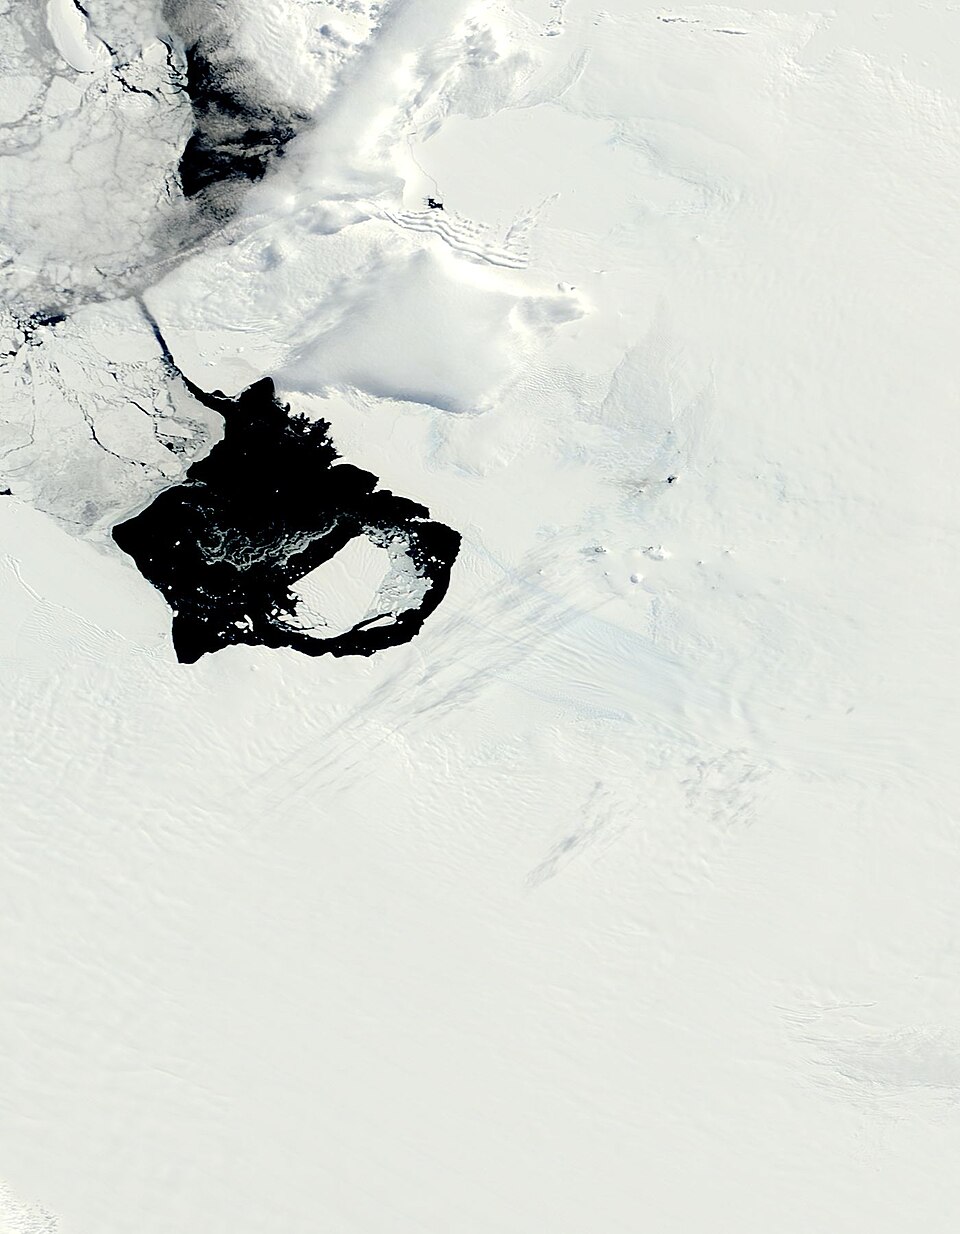
A chunk of ice the size of Rhode Island collapsed in six weeks. That was 2002, and the Larsen B ice shelf in Antarctica took less than two months to disintegrate, causing the glaciers behind it to speed up four to sixfold. Scientists have spent more than two decades trying to understand how it happened and whether it could happen again, at a larger scale.
Now, researchers at Caltech have published new findings that bring those predictions closer to reality. According to Phys.org, the study used nine years of satellite data on the flow of Antarctic glaciers to measure and model how and why ice shelves collapse. The paper appeared in the journal Proceedings of the National Academy of Sciences on August 11.
The research focused on the Pine Island Glacier in West Antarctica, the fastest-flowing glacier on the continent and the region's largest contributor to sea-level rise. Its movement toward the ocean is slowed by the Pine Island Ice Shelf, which acts as a kind of brake. Scientists describe this braking force as buttressing stress. In 2017, a large section of that ice shelf broke off and became an iceberg. Since then, the glacier has increased its flow speed by 20 percent.
The stakes are significant. Current estimates put sea-level rise between half a meter and two meters by the end of the century. Every centimeter of rise could displace 1.5 million people. Approximately one-third of the world's population lives within a day's walk of a coastline.
The work was conducted in the laboratory of Brent Minchew, a professor of geophysics at Caltech. He described the potential consequences in stark terms. "The potential population displacement caused by sea-level rise is on the order of the displacement seen during World War II, except sustained over entire lifetimes," Minchew says. "That scale of disruption historically comes with conflict. Coastal adaptation is costly, and roughly 90% of people at risk live in low- to mid-income countries. It is critical to understand the future scenario we're facing so that we can most efficiently use resources to prepare."
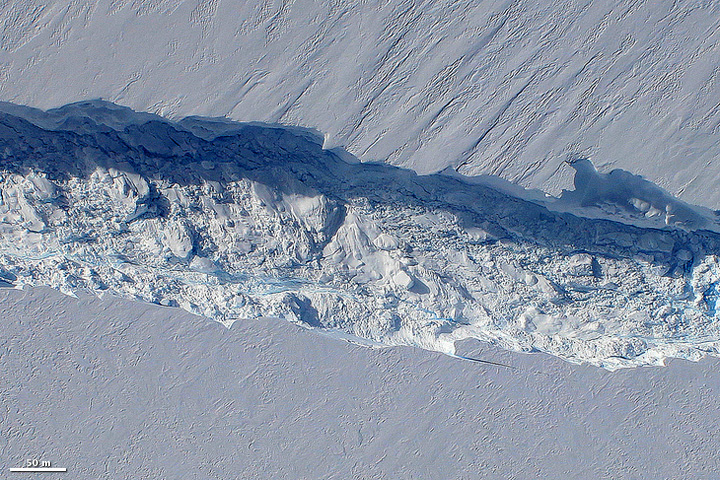
One of the central challenges in this research is the complexity of glacial ice itself. Glaciers cover thousands of square kilometers and persist for thousands of years. That makes them fundamentally different from ice in a laboratory setting. Over time, tiny defects build up in the crystalline structure of the ice and grow into larger damage, including jagged crevasses that can extend hundreds of meters deep. Understanding exactly when and where that damage will cause an ice shelf to break apart has been difficult to model with precision.
The Larsen B collapse remains one of the most dramatic illustrations of how fast things can change. "In 2002, the Larsen B ice shelf — which had an area comparable to Rhode Island — in Antarctica collapsed over the course of just six weeks, leading to its glaciers speeding up four- to sixfold," the paper notes. That kind of acceleration feeds directly into sea-level rise projections.
The Caltech team's new models, built on nearly a decade of real satellite observations rather than theoretical assumptions, are intended to sharpen those projections. Knowing when and where ice shelves are likely to calve next gives coastal planners and governments more reliable timelines to work with as they build infrastructure and prepare communities for rising seas.