

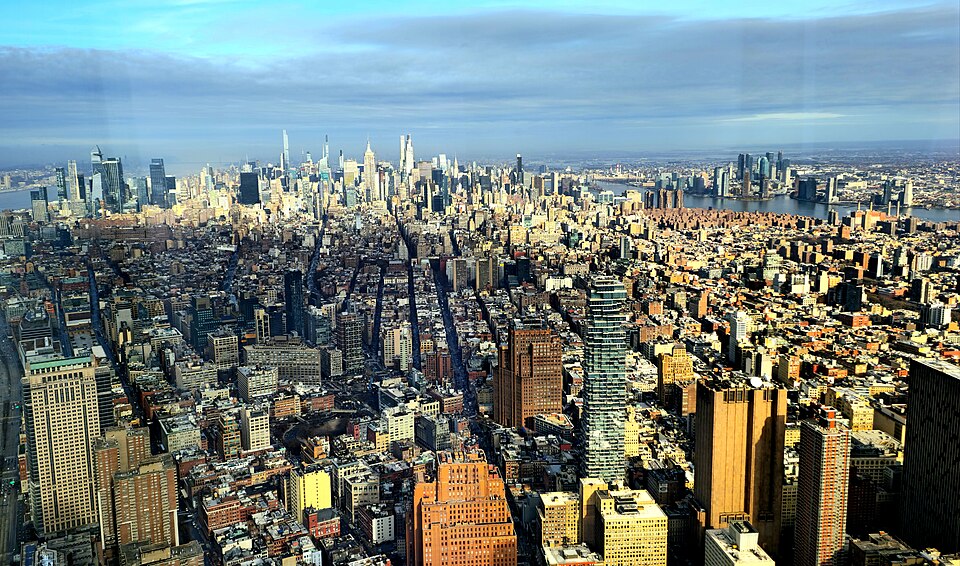
Cornell engineers have built a real-time virtual model of Manhattan designed to track carbon dioxide levels across the city, a tool they say could help planners spot pollution hotspots and test solutions before putting them into practice.
The project, published in the journal Environmental Modelling & Software and reported by Phys.org, was led by H. Oliver Gao, director of the Systems Engineering Program and the Center for Transportation, Environment, and Community Health in the Cornell Duffield College of Engineering.
The system is called a digital twin, a real-time digital replica of a physical environment that continuously pulls in real-world data. The researchers chose Manhattan as a test case because of its density and complexity, not because it was easy.
"We chose Manhattan as our pilot site because it is a dense and complex urban environment that would be a challenging test for our digital twin," said Yishuo Jiang, an Ezra Postdoctoral Fellow in the Systems Engineering Program and co-lead author of the study.
Urban environments are difficult to model precisely because their systems do not operate independently. Transportation, energy, water, waste, and public health are all connected, and the data used to manage them often come from different sources, formats, and timelines. A small change in one system can ripple through the others, making it hard to get a complete picture of how a city is functioning at any given moment.
The Cornell team built their digital twin using four layers that work together. The physical layer collects raw data from large databases. The digital layer organizes and models that data. The brain layer applies Bayesian modeling and machine learning to predict outcomes. The service layer then suggests actions and provides visualization tools for decision-makers.
Using this framework, the researchers were able to pull together data from different sources into one platform, monitor carbon dioxide concentrations across Manhattan, measure uncertainty in the data, and generate maps showing how conditions varied across different parts of the city.
The ability to visualize emissions at a neighborhood level is one of the system's practical advantages. City planners and policymakers could use such maps to identify where emissions are highest, evaluate what interventions might lower them, and track whether changes are working without waiting for years of real-world data to accumulate.
The researchers see the Manhattan prototype as a starting point. As cities grow and the challenge of managing urban health and sustainability increases, integrated real-time models may become a standard tool for city management. The digital twin framework is designed to be modular, meaning additional data layers or systems could be added as needs evolve.
![500px provided description: Free Creative Commons Photography. Use this photo however you like. Find more CC photos here: goo.gl/photos/6TB8VNQ6ADSk9T729 [#city ,#water ,#buildings ,#urban ,#architecture ,#cityscape ,#new york ,#building ,#new york city ,#nyc ,#manhattan]](https://freenewspress.com/media/2026/08/21/manhattan-aerial-cityscape-e763b2.jpeg)