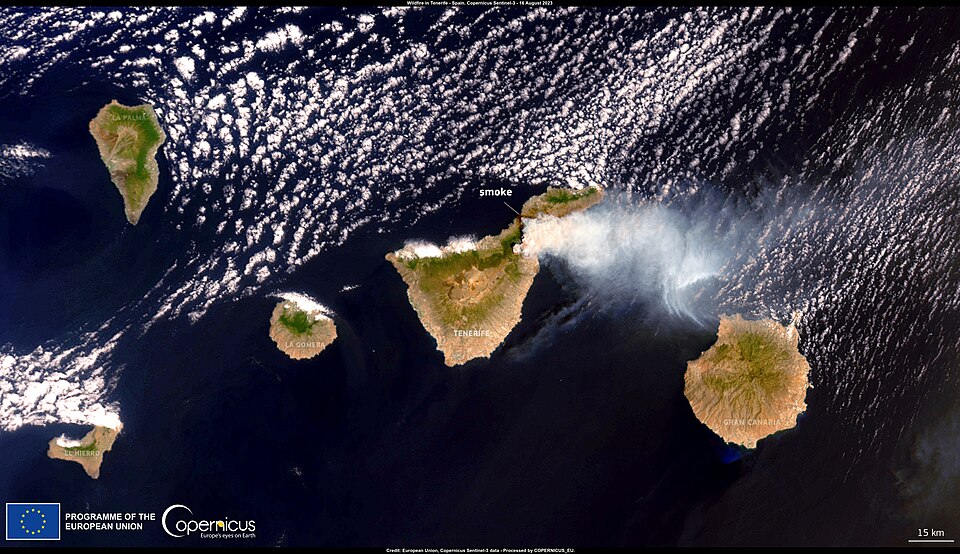
Anyone with an internet connection can now track wildfires from space with more clarity, using a free European satellite service that added a dedicated fire visualization layer on August 4.
The Copernicus Browser, which provides free public access to imagery from the European Space Agency's Sentinel satellites, added the wildfire layer to its Sentinel-2 options. According to Ars Technica, the update makes an already powerful tool significantly easier to use for monitoring fires in real time.
The Sentinel-2 mission uses three satellites that capture multi-spectral imaging at resolutions as fine as 10 meters in visible light and near-infrared bands. The browser previously offered 10 default visualization layers using different combinations of spectral bands. The new wildfire layer is designed to be immediately readable without technical knowledge.
When a user selects the wildfire layer while viewing a fire-affected location, active fires appear in white or yellow, burning vegetation shows in red, and burned landscapes appear in dark brown or black. The color scheme allows fast visual interpretation of fire behavior and scope across wide areas.
The layer is built on a script written in JavaScript by Pierre Markuse, a remote sensing expert. His script pulls from three separate data channels. It combines the red visible light band with the narrow near-infrared band, which reveals the difference between healthy and burned vegetation, and the short-wave infrared 2 band, which shows moisture levels in the soil and helps identify burned ground.
Markuse's script was written nearly a decade ago and had been used by researchers and fire monitoring professionals before it was formally integrated into the Copernicus Browser. Its inclusion as a default layer makes it accessible to a much wider audience, including emergency managers, journalists, and members of the public tracking fires near their communities.
The Copernicus program is funded by the European Union and operates as a free and open service. The Sentinel-2 satellites continuously collect imagery across the globe, making it possible to monitor fast-moving fire situations with near-daily updates in many regions.